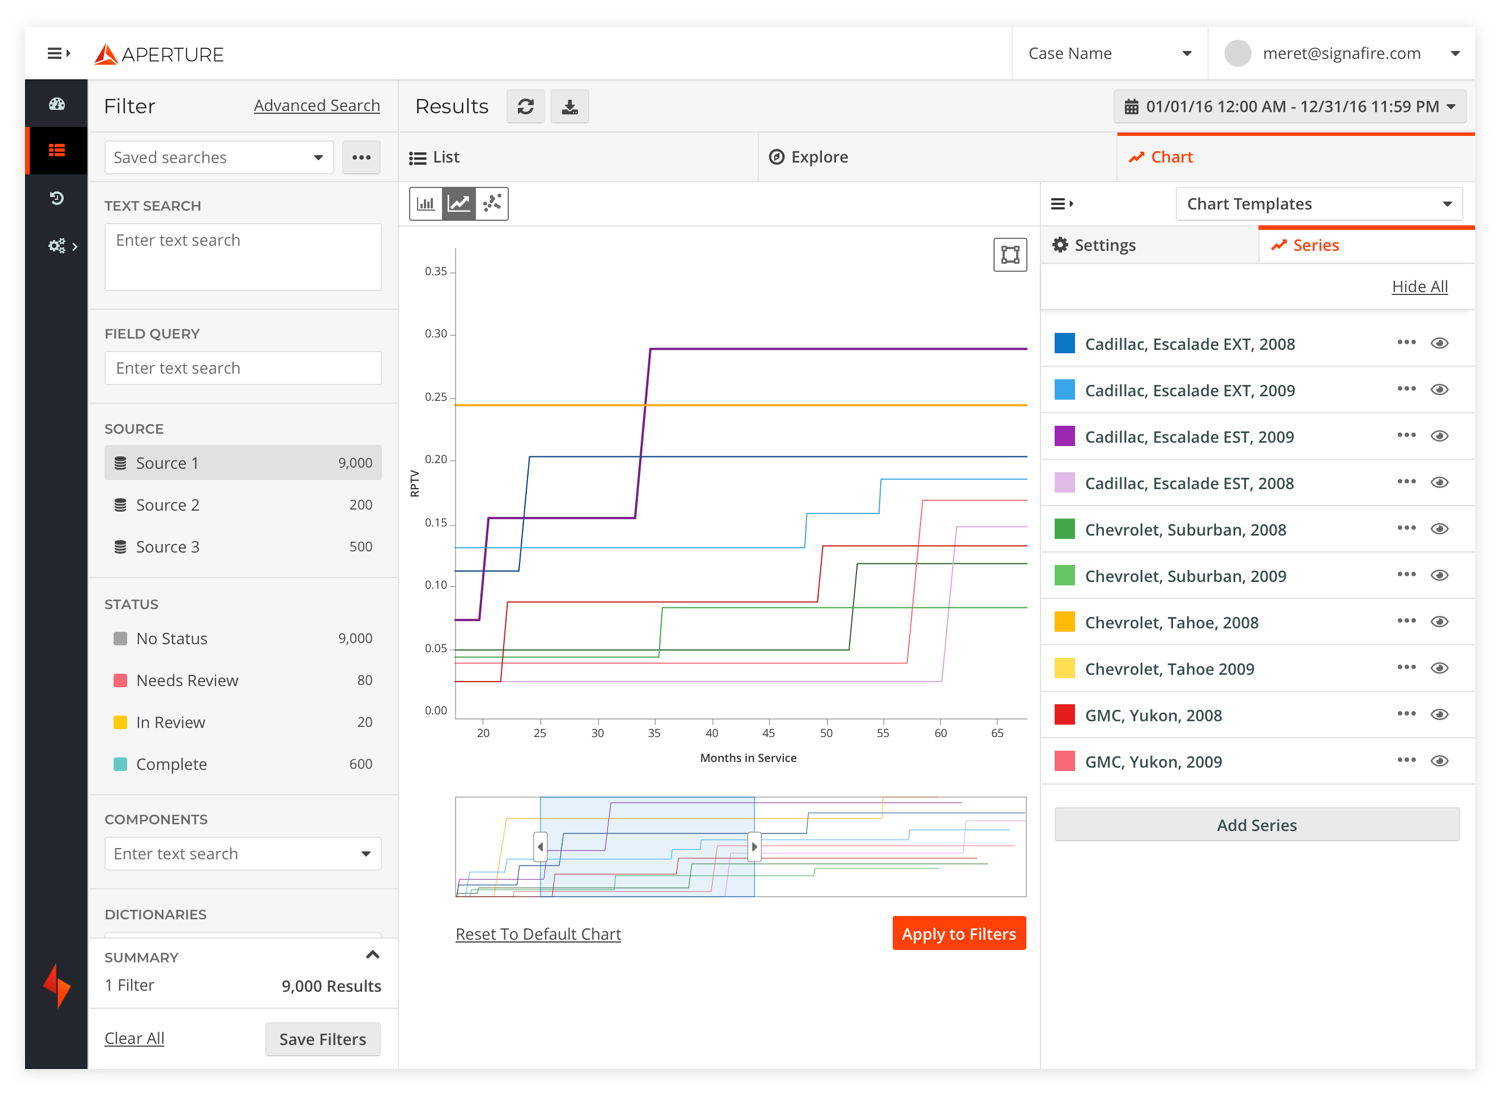
The Aperture Chart Builder was designed to help analysts visualize patterns in large-scale, multi-source datasets. It provides a flexible interface for querying structured and unstructured data, filtering by key attributes like source, status, and components. The dynamic charting system enables users to explore trends over time, compare categorical variables, and refine their visualizations with interactive controls.
As the lead engineer and team lead on this project, I wrote the core charting logic and led a team to build out the full feature set. This feature included a chart templating tool, support for various basic chart types, a brush/zoom tool, ability to quickly add / remove series to plot, and more. As indicated by the search filters on the left in the screenshot above, the charting tool was fully integrated with the core search tool of the app as well, enabling users to quickly drill down their data to uncover new insights.
All charts were built in D3.js, and we leveraged Angular’s Renderer2 class to give us fine-grained control over the render loop and ensure smooth visual updates as the user tweaked chart settings and filters.